HYPE liquidation levels and positioning: a 72-hour snapshot
HYPE liquidation levels over the 72 hours to 28 October 2026, the largest tracked positions, long/short by wallets and dollars, and funding.
On this page
HYPE is the native token of Hyperliquid and one of its largest perpetual markets. Because every Hyperliquid position is public, we can show where tracked HYPE positions would be liquidated, who holds the biggest ones and how the market was split between longs and shorts. This post freezes that picture for the 72 hours up to our snapshot on 28 October 2026.
New to the chart? How to read a liquidation heatmap explains it step by step. For what open interest and the long/short ratio can and cannot tell you, see Open interest and long/short.
Liquidation levels over three days
At the snapshot HYPE traded at $80.4. The map covers the 72 hours before it, with price buckets of $0.5, and is built from 2,743 tracked HYPE positions.
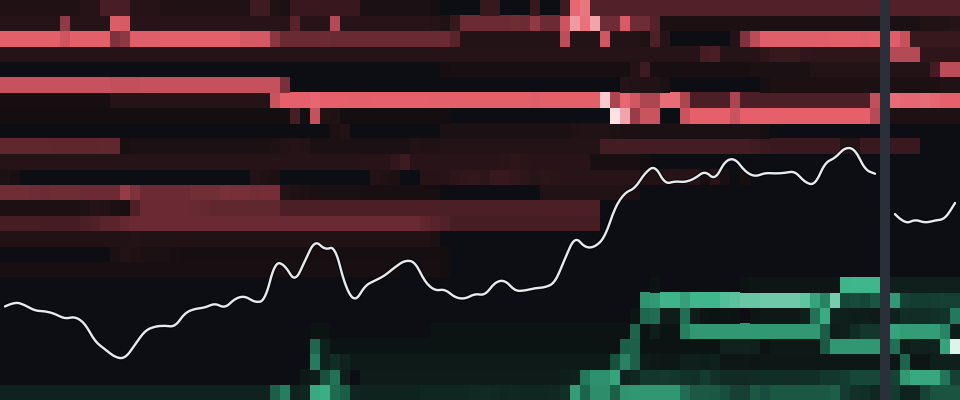
- Mark price
- $80.42,743 tracked positions
- Largest long cluster
- $14.9Mat $76.75 · −4.5%
- Largest short cluster
- $2.6Mat $87.75 · +9.1%
Within ±5% of the price:$17.2M long levels$1.5M short levels
The picture was lopsided. The largest long cluster was $14.9M at $76.75, only −4.5% below the price. The largest short cluster was $2.6M at $87.75, +9.1% above it.
Close to the price the difference was even clearer. Within five percent below the price, tracked long liquidations added up to $17.2M; within five percent above it, short liquidations came to $1.5M. Over a ten percent band the totals were $45.4M on the long side and $5.7M on the short side.
Put simply: at the snapshot there was much more long size that would be liquidated by a fall than short size that would be liquidated by a rise, and the long side sat closer to the price. That describes positioning at one moment. It is not a forecast of the next move.
The largest positions
| # | Wallet | Coin | Side | Size | Leverage | To liquidation |
|---|---|---|---|---|---|---|
| 1 | 0x082e…ca88 | HYPE | Long | $111M | 5x | −13.4% |
| 2 | 0xf02d…54c6 | HYPE | Short | $58.4M | 5x | +27.1% |
| 3 | 0xb83d…6e36 | HYPE | Short | $47.9M | 5x | +256.2% |
| 4 | 0x5b5d…c060 | HYPE | Short | $38.2M | 5x | +373.2% |
| 5 | 0x6666…23f5 | HYPE | Long | $36.1M | 10x | −46.3% |
Distance to liquidation = how far the mark price has to move before Hyperliquid liquidates the position (read from Hyperliquid at the snapshot).
The largest tracked HYPE position was a $111M long at 5x from 0x082e…ca88, with its liquidation price −13.4% from the price. It is large, but its liquidation level lies below the range of the map.
Three of the next four were shorts at 5x. The $58.4M short had its liquidation price +27.1% above the price; the $47.9M and $38.2M shorts were much further away (+256.2% and +373.2%). Shorts with that much margin are hard to liquidate, which is one reason the short side of the map was so dark despite these large positions.
The fifth, a $36.1M long at 10x, was −46.3% from its liquidation price.
The lesson from the table is the same as on other coins: the size of a position and its risk of liquidation are different things. The bright bands on the map come from positions whose liquidation price is near, whatever their size.
Long/short: wallets and dollars
| Coin | Long size | Short size | Ratio (USD) | Long wallets | Short wallets | Ratio (wallets) |
|---|---|---|---|---|---|---|
| HYPE | $756M | $665M | 1.14 | 1,852 | 891 | 2.08 |
Ratio in USD = long size ÷ short size. Ratio in wallets = wallets holding a long ÷ wallets holding a short.
By number of wallets, tracked HYPE traders leaned long: 1,852 wallets held longs and 891 held shorts, a wallet ratio of 2.08. By dollar size the split was much closer: $756M long against $665M short, a ratio of 1.14.
When the two ratios differ like this, many smaller accounts are on one side and fewer, larger accounts on the other. Here the long side had more wallets, while large shorts brought the dollar totals close together. The long/short ratio in our glossary explains both variants.
Funding at the snapshot
| Coin | Hyperliquid, per hour | Annualised | Spread across venues | Open interest (HL) |
|---|---|---|---|---|
| HYPE | −0.00295% | −25.85% | - | $1.7B |
Spread = highest minus lowest annualised rate across the venues we track; shown only where it does not reveal a single exchange's own rate.
The Hyperliquid funding rate for HYPE was −0.00295% per hour, −25.85% annualised, on open interest of $1.7B. A negative rate means shorts pay longs. So even though more wallets were long, the perpetual traded in a way that had shorts paying at that hour. Funding rates explained covers how the rate is set and how to compare hourly and 8-hour rates.
How to use this view
- Start with distance. The long cluster above was close to the price; the short clusters were far away. The live map prints the distance of every large cluster, so you can see at a glance which side a move would reach first.
- Look behind a band. The HYPE whales tab lists the largest positions with their liquidation prices. A band made of one wallet can disappear in minutes when that wallet adds margin or closes.
- Read both ratios. The HYPE positioning tab shows open interest, funding and the dollar long/short ratio over time. A wallet ratio far above the dollar ratio means many small longs against fewer large shorts, as in this snapshot.
- Check your own level. The liquidation calculator shows where a position with a given size, leverage and margin would be liquidated, with Hyperliquid's margin tiers.
Limits of the data
- Tracked wallets only. All position numbers come from the Hyperliquid wallets we follow, not from every account or from other venues.
- Minutes to hours old. Each position is read on a schedule: the largest wallets every few minutes, smaller ones less often, so a position can be minutes or hours old at the snapshot.
- One moment. Everything here is frozen at the snapshot time. The live HYPE heatmap, the HYPE whales tab and funding rates show the current values.
- Levels move. Margin added or removed, funding and profit or loss on other positions change liquidation prices all the time.
To follow one of these wallets, or your own, Guard sends an alert when a position comes close to its liquidation price.
Sources
Blockmetric data, frozen at the time shown:
- Liquidation heatmap · HYPE: Hyperliquid (tracked positions), snapshot 28 Oct 2026, 18:25 UTC · Live HYPE heatmap
- Largest positions · HYPE: Hyperliquid (tracked wallets), snapshot 28 Oct 2026, 18:24 UTC · Live whale positions
- Long/short: Hyperliquid (tracked positions), snapshot 28 Oct 2026, 18:25 UTC · Live long/short
- Funding per coin: Hyperliquid, snapshot 28 Oct 2026, 18:25 UTC · Live funding rates
How we collect and check the data: Data & methodology.
See today’s numbersThe figures above are from 28 Oct 2026, 18:25 UTC.
See the live HYPE heatmap