Open interest and long/short: what they tell you, what they don't
What open interest and the long/short ratio measure, why the ratio by wallets and by USD can disagree, and what neither says about direction, with BTC.
On this page
Open interest and the long/short ratio are two of the most quoted numbers in crypto derivatives, and two of the most misread. Open interest is often treated as a measure of bullishness, the long/short ratio as a vote on direction. Neither is. This guide explains what each number measures, shows them on real BTC data from our snapshot, and lists what they cannot tell you.
What open interest measures
Open interest is the total size of all derivative positions that are open right now. Every contract has two sides (one long, one short), so open interest counts each contract once, not once per side. A market with rising open interest has more money committed to positions; it does not have "more longs".
Three details matter when you read it:
- It is a stock, not a flow. Volume counts trades; open interest counts what is still open after them. A day with heavy volume can leave open interest unchanged if positions are opened and closed in equal measure.
- It is usually shown in USD. USD open interest is the number of contracts times the price. If the price rises and no one trades, USD open interest still rises. Comparing open interest with the price on the same chart separates the two effects.
- It is per venue. Each exchange reports its own figure. A total across venues is a sum of different markets with different traders.
Here is BTC over the three days before our snapshot, summed over the venues we track:
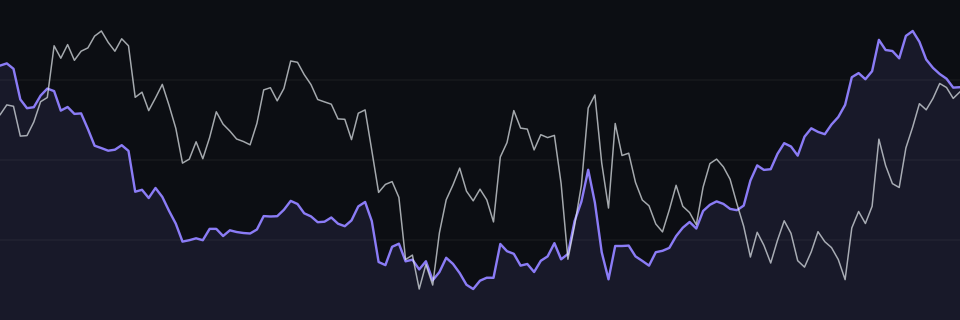
- Open interest
- $16.3Bfrom $16.4B
- Change
- −0.4%over 72 hours
- Price change
- +0.2%$80,486 → $80,620
- On Hyperliquid
- $3.5B21% of the total
Open interest summed over Binance, Bybit, Hyperliquid at the same 5-minute steps; price = Hyperliquid mark.
Over the window, BTC open interest moved from $16.4B to $16.3B, a change of −0.4%, while the price moved +0.2%. In between, open interest ranged from $15.7B to $16.5B. Hyperliquid held $3.5B of it, 21% of the total across 3 venues.
A flat line like this one is also information: over these three days, positions were opened and closed in roughly equal measure, and the market's committed size barely changed.
How open interest and price are usually read together
A common reading combines the direction of open interest with the direction of the price:
| Price | Open interest | Common reading |
|---|---|---|
| Up | Up | New positions are being opened as the price rises |
| Up | Down | Positions are being closed, for example shorts covering |
| Down | Up | New positions are being opened as the price falls |
| Down | Down | Positions are being closed, for example longs exiting or being liquidated |
The table is a starting point, not a rule. It describes which way size is moving, not who is right. "New positions as the price rises" can be new longs paying up, or new shorts opened into the rise; open interest alone cannot tell the two apart, because every new contract has both.
What the long/short ratio measures
The long/short ratio divides the long side by the short side. The catch is in the word "side": different sources divide different things.
- By accounts or wallets: the number of accounts holding a long divided by the number holding a short. Every account counts once, however large.
- By size: the USD size of all longs divided by the USD size of all shorts. A single large position can move it.
- By "top traders": the same ratios restricted to a venue's largest accounts.
On Hyperliquid, where positions are public, we can compute both of the first two from the same tracked wallets:
Ratio in USD = long size ÷ short size. Ratio in wallets = wallets holding a long ÷ wallets holding a short.
The two ratios disagree. For BTC, the ratio by wallets was 1.91: 2,382 wallets held a long and 1,250 a short, so 66% of the wallets were long. The ratio by size was 0.97: the short side held $1.6B against $1.6B on the long side. More wallets were long, but slightly more money was short. HYPE showed the same pattern even more clearly, at 2.04 by wallets and 1.14 by size.
This is common: many small accounts lean one way while fewer, larger accounts hold the other side. A headline "long/short ratio" without the word "accounts" or "size" next to it is missing half its meaning.
Open interest, liquidations and funding
Open interest falls in two ways: traders close positions, or the exchange closes them for them. A sharp drop in open interest during a fast move often comes with liquidations: each forced close reduces open interest unless a new position takes the other side of it. Our liquidations page shows the confirmed liquidations of the same hours, which tells the two causes apart.
Funding is the third number that belongs next to these two. When open interest grows and funding rises with it, the new positions are mostly paying to hold longs; when open interest grows while funding turns negative, shorts are paying. Funding adds the price of holding a position to the size of it (see funding rates explained).
A practical routine for one coin:
- Check whether open interest moved more than the price. If both moved by about the same percentage, most of the change is the price, not new positions.
- Check the long/short ratio both ways (by wallets and by size) and note when they disagree.
- Check funding and the liquidation feed to see who is paying and who was forced out.
What neither number tells you
- Direction. Open interest has no direction, and the long/short ratio describes positions, not the next move. Crowded positioning can persist for a long time.
- Intent. A short can be a hedge of a spot holding, part of a funding arbitrage or an outright bet. The ratio counts all of them the same way.
- The whole market. Our wallet ratios cover tracked Hyperliquid positions; exchange ratios cover their own accounts. Each is a sample of a different crowd.
- Leverage and distance to liquidation. Two markets with the same open interest can carry very different risk. For that, the liquidation heatmap of a coin shows where its positions would be closed.
Where to find these numbers
Every coin's positioning tab shows open interest, funding and the long/short ratio over time, next to the price. The long/short page compares coins side by side. The glossary defines open interest and the long/short ratio in one sentence each.
The numbers in this post are frozen at the snapshot time shown on each block. For today's values, open the live positioning page.
Sources
Blockmetric data, frozen at the time shown:
- Open interest chart · BTC: Binance · Bybit · Hyperliquid, snapshot 27 Oct 2026, 18:55 UTC · Live BTC positioning
- Open interest · BTC: Binance · Bybit · Hyperliquid, snapshot 27 Oct 2026, 18:55 UTC · Live BTC positioning
- Long/short: Hyperliquid (tracked positions), snapshot 27 Oct 2026, 18:57 UTC · Live long/short
How we collect and check the data: Data & methodology.
See today’s numbersThe figures above are from 27 Oct 2026, 18:57 UTC.
See BTC positioning