How to read a liquidation heatmap
What the bands of a liquidation heatmap mean, how long and short clusters differ, how price meets them and where the data stops, with a BTC example.
On this page
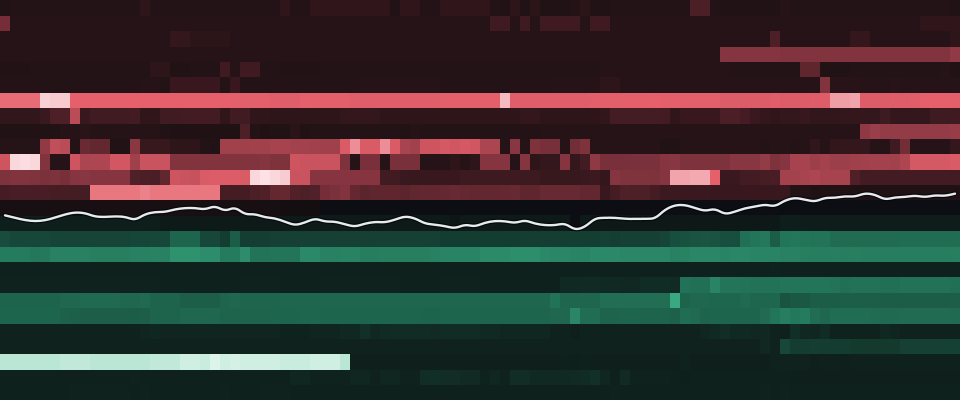
A liquidation heatmap shows where open leveraged positions would be force-closed if the price got there. Bright bands are price levels where a lot of position size sits close to its liquidation price. This guide explains how to read those bands, using the BTC heatmap from our data exactly as it stood at the snapshot below.
What the heatmap shows
Every leveraged position on Hyperliquid has a liquidation price: the mark price at which the account's equity falls below its maintenance margin and the exchange starts closing the position.1 We read those prices for every wallet we track, add up the position size per price bucket and draw the result as a grid. Time runs from left to right, price from bottom to top, and the brightness of a cell is the USD size that would be liquidated at that price at that time.
- Mark price
- $80,7063,631 tracked positions
- Largest long cluster
- $43.3Mat $78,750 · −2.4%
- Largest short cluster
- $37.9Mat $83,750 · +3.8%
Within ±5% of the price:$204M long levels$116M short levels
Three things in the chart matter most:
- The white line is the mark price. Everything below it is long liquidations, everything above it is short liquidations: a long is liquidated when the price falls, a short when it rises.
- Green cells are long liquidation levels, red cells short liquidation levels. Each side is coloured on its own scale, so a bright green band means "large for longs", not "larger than the red band next to it".
- Horizontal bands that stay bright for hours are levels where size has been parked for a while. Bands that appear and fade show positions being opened, closed or topped up with margin.
Reading the example
At the snapshot, BTC traded at $80,706. The largest long cluster within ten percent of the price sat at $78,750, −2.4% away, with $43.3M of position size that would be liquidated there. The largest short cluster sat at $83,750, +3.8% above the price, with $37.9M.
Summed over the band within five percent of the price, $204M of long positions and $116M of short positions had their liquidation price inside it. Within ten percent it was $301M of longs and $176M of shorts. In plain words: at that moment, more long size than short size sat close to its liquidation price.
That is a description of positioning, not a forecast. It says where forced orders would appear, not whether the price will get there. The grid uses price buckets of $500, and its numbers come from 3,631 tracked BTC positions.
Clusters, and what happens when price reaches one
A cluster is a bucket, or a few neighbouring buckets, with much more size than the levels around it. When the mark price trades into a long cluster, the positions in it fall below their maintenance margin. Hyperliquid first tries to close them with market orders on the order book; only if that fails does a backstop vault take them over.1
Those closing orders point in the same direction as the move that triggered them: a falling price closes longs with orders against the bids, a rising price closes shorts with orders against the asks. That is why a move into a dense cluster can speed up for a short time. Each forced close adds an order in the direction of the move, which can carry the price to the next level.
For scale, here is what was actually liquidated across the venues we track in the 24 hours before the snapshot:
- Total
- $82.9M39,039 liquidation orders
- Longs liquidated
- $29.9M
- Shorts liquidated
- $53M
Exchange totals as reported on their public liquidation streams; Hyperliquid liquidations confirmed by fills of tracked wallets.
Of the $82.9M in that window, $29.9M were longs and $53M were shorts. Hyperliquid accounted for $3.7M; the rest are exchange totals as published on their public streams.
Three patterns are worth knowing when you read a heatmap over time:
- Price stops short of a cluster. Large clusters are visible to everyone, including the traders who hold those positions. Many of them add margin or reduce size as the price approaches, and the band fades before it is reached. A fading band is a band that moved, not one that was hit.
- Price runs through a cluster. The band disappears from one column to the next, and the liquidation feed shows forced closes at those levels. Our liquidations page lists them as they are confirmed.
- Two-sided clusters. When both sides have size close to the price, a move in either direction meets forced orders. The heatmap shows this as bright bands just above and just below the white line.
How often the price actually reached the largest published clusters in the past is measured on our scoreboard, which records each cluster and whether it was hit within a fixed time.
Long vs short at a glance
A quick routine for any coin:
- Compare both sides of the line. More green close below the price means more long size near liquidation; more red close above means more short size.
- Look at distance, not only size. A cluster of $37.9M that is +3.8% away matters less for the next hours than a smaller one half as far from the price.
- Watch the change over time. A band that keeps growing over several hours means new positions keep ending up with that liquidation price, usually because they were opened at similar prices with similar leverage.
Limits of the data
A heatmap is only as good as the positions behind it. Ours has four limits we state plainly:
- Tracked wallets in the live columns. Live columns, like the example above, sum the positions of the Hyperliquid wallets we track, not every account. 1D columns, and intraday columns from before our live collection or without a live snapshot, show a daily snapshot of every open Hyperliquid position instead, which is up to a day old. Liquidation levels on Binance or Bybit are not public per position, so they are not in this chart.
- Minutes old. Each wallet is re-read on a schedule, so a cell can lag a position that was just closed or topped up. Every column of the chart is a stored snapshot with its own time.
- Liquidation prices move. Funding payments, profit or loss on other positions in a cross-margin account, and margin added or removed all shift a liquidation price. A level is a snapshot, not a fixed line.
- Size is not impact. A large cluster does not move the price by a fixed amount when it is hit. What happens depends on the order book at that moment.
Read the heatmap together with the order flow and positioning tabs of the same coin. Order flow shows whether the market is actually trading towards a level; positioning shows whether open interest is growing or shrinking while it does. The terms are explained in our glossary: liquidation cluster and distance to liquidation.
The numbers in this post are frozen at the snapshot time shown on each block. For today's levels, open the live heatmap.
Sources
- Hyperliquid Docs, "Liquidations": https://hyperliquid.gitbook.io/hyperliquid-docs/trading/liquidations (accessed 2026-11-05)Back to text
Blockmetric data, frozen at the time shown:
- Liquidation heatmap · BTC: Hyperliquid (tracked positions), snapshot 27 Oct 2026, 19:55 UTC · Live BTC heatmap
- Liquidation totals: Binance · Bybit · Hyperliquid, snapshot 27 Oct 2026, 19:55 UTC · Live liquidations
How we collect and check the data: Data & methodology.
See today’s numbersThe figures above are from 27 Oct 2026, 19:55 UTC.
See the live BTC heatmap