Where ETH positions would be liquidated: a 24-hour snapshot
Where tracked ETH positions on Hyperliquid would have been liquidated on 28 October 2026: the largest long and short clusters and the whales behind them.
On this page
On 28 October 2026 we froze the ETH liquidation heatmap for the 24 hours up to our snapshot. It shows where the ETH positions we track on Hyperliquid would be force-closed, and how much size sits at each price. This post walks through what the snapshot showed: one large long cluster below the price, a thinner short side above it, and a handful of wallets that account for much of both.
If you have not used a liquidation heatmap before, the guide How to read a liquidation heatmap explains the colours, the bands and the limits first. Here we only read this one picture.
The snapshot
At the snapshot ETH traded at $2,345. The map below covers the 24 hours before it and is built from 2,049 tracked ETH positions, each with the liquidation price Hyperliquid reports for it. The price axis is split into buckets of $10.
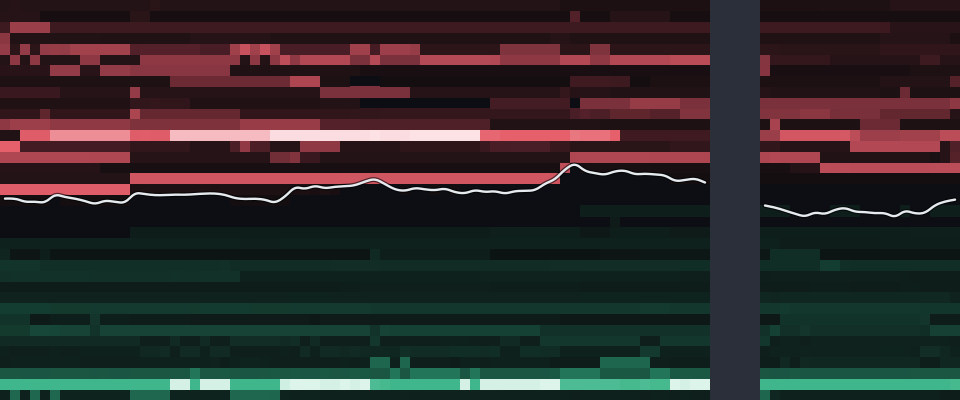
- Mark price
- $2,3452,049 tracked positions
- Largest long cluster
- $223Mat $2,175 · −7.3%
- Largest short cluster
- $38.2Mat $2,575 · +9.8%
Within ±5% of the price:$13.7M long levels$16.1M short levels
Green cells below the white price line are long positions that would be liquidated if the price fell to that level. Red cells above it are shorts that would be liquidated if the price rose. The brighter the cell, the more dollar size sits there.
The long side: one dominant cluster
The largest long cluster was $223M at $2,175, −7.3% from the price at the snapshot. Nothing else on the long side came close to that size.
Near the price there was very little. Within five percent below the price, tracked long liquidations added up to $13.7M. Widening the band to ten percent took the total to $319M, so almost all of the long size sat in the lower half of that wider band, around the big cluster.
That is a typical shape for a market where size is concentrated in a few accounts: a quiet area close to the price, then one band where a lot of positions share almost the same liquidation price. A liquidation cluster like this is a level to be aware of, not a forecast. It says where forced closes would start if the price got there, nothing about whether it will.
The short side: thinner and further away
Above the price the map was much darker. The largest short cluster was $38.2M at $2,575, +9.8% away. Within five percent above the price, tracked short liquidations came to $16.1M; within ten percent, $70.5M.
So close to the price the two sides were similar in size, but further out the long side was several times heavier. A move down of the size of the long cluster's distance would have met far more liquidation size than a move up of the same size.
Who sits behind the bands
Because Hyperliquid positions are public, the bands can be traced back to individual wallets. These were the five largest tracked ETH positions at the snapshot:
| # | Wallet | Coin | Side | Size | Leverage | To liquidation |
|---|---|---|---|---|---|---|
| 1 | 0x5b5d…c060 | ETH | Short | $249M | 5x | +60.9% |
| 2 | 0xb83d…6e36 | ETH | Short | $154M | 5x | +85.1% |
| 3 | 0x77dd…e0e9 | ETH | Long | $114M | 10x | −7.4% |
| 4 | 0x0392…d7d9 | ETH | Long | $105M | 9x | −7.0% |
| 5 | 0xde8d…9524 | ETH | Long | $70.9M | 20x | −23.8% |
Distance to liquidation = how far the mark price has to move before Hyperliquid liquidates the position (read from Hyperliquid at the snapshot).
The two largest were shorts: $249M from 0x5b5d…c060 and $154M from 0xb83d…6e36, both at 5x. Their liquidation prices were far above the price (+60.9% and +85.1%), which is why they barely show on the map: large size, but a lot of margin behind it.
The next two were longs: $114M at 10x and $105M at 9x, with liquidation prices −7.4% and −7.0% from the price. Those distances sit right next to the largest long cluster. At this size, two wallets alone can make up most of a band, which is worth keeping in mind when a single bright line looks like "the market".
The fifth, a $70.9M long at 20x, had its liquidation price −23.8% below the price, outside the range of the map.
How to use this view
- Read distance, not only size. A cluster that is ten percent away needs a much larger move than one that is two percent away. The heatmap shows both; the distance is printed next to each cluster in the live view.
- Check who is behind a band. The ETH whales tab lists the largest positions with their liquidation prices, so you can see whether a band is many small accounts or a few large ones.
- Watch it change. Clusters move when positions are opened, closed or topped up with margin. A band that fades over a few hours was not "hit"; its owners changed their positions.
- Your own position. If you hold ETH on Hyperliquid, Guard alerts you when your own position comes close to its liquidation price.
Limits of this snapshot
- Tracked wallets only. The map shows the positions of the wallets we follow on Hyperliquid, not every account and not other venues. Exchanges do not publish their users' positions.
- Minutes to hours old. Positions are read wallet by wallet on a schedule: the largest wallets every few minutes, smaller ones less often, so a position can be minutes or hours old at the snapshot.
- A moment, not a trend. The numbers above are frozen at the snapshot time. The live ETH heatmap shows the levels as they are now, and they will differ.
- Margin can change. Funding payments, profit and loss on other positions in a cross-margin account and added margin all move a liquidation price. A level is where a position would be liquidated at the time of the read.
The live map, the whale list and the alerts all use the same data as this post, updated continuously.
Sources
Blockmetric data, frozen at the time shown:
- Liquidation heatmap · ETH: Hyperliquid (tracked positions), snapshot 28 Oct 2026, 18:25 UTC · Live ETH heatmap
- Largest positions · ETH: Hyperliquid (tracked wallets), snapshot 28 Oct 2026, 18:24 UTC · Live whale positions
How we collect and check the data: Data & methodology.
See today’s numbersThe figures above are from 28 Oct 2026, 18:25 UTC.
See the live ETH heatmap