Bitcoin and Ether open interest over 14 days
BTC and ETH open interest over the 14 days to 5 November 2026: start and end, the range in between, the price change and the share held on Hyperliquid.
On this page
Over the 14 days to our snapshot on 5 November 2026 (17:40 UTC), BTC open interest across the venues we sum changed by −4.3% to $15.6B, while the BTC price moved −2.6%. ETH open interest changed by −3.6% to $9.2B, while the ETH price moved −1.8%. This post shows both two-week curves, compares them side by side and explains what the comparison can and cannot tell you.
What open interest is and how it is usually read together with price is covered in Open interest and long/short. The definition is on the open interest page. Here we only read two weeks of data.
BTC: two weeks of open interest
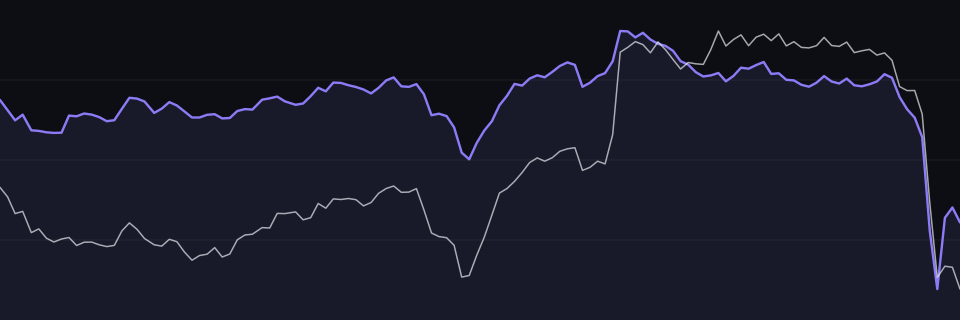
The violet line is BTC open interest summed over the venues named under the chart. The pale line is the Hyperliquid price of BTC on its own scale. Over the two weeks (336 hours), open interest ranged from $15.1B to $16.8B, and the price from $75,650 to $80,881.
- Open interest
- $15.6Bfrom $16.3B
- Change
- −4.3%over 336 hours
- Price change
- −2.6%$77,900 → $75,865
- On Hyperliquid
- $3.1B20% of the total
Open interest summed over Binance, Bybit, Hyperliquid, Lighter at the same 5-minute steps; price = Hyperliquid mark.
At the start of the window BTC open interest was $16.3B; at the end it was $15.6B, a change of −4.3%. The price went from $77,900 to $75,865, a change of −2.6%.
ETH: two weeks of open interest
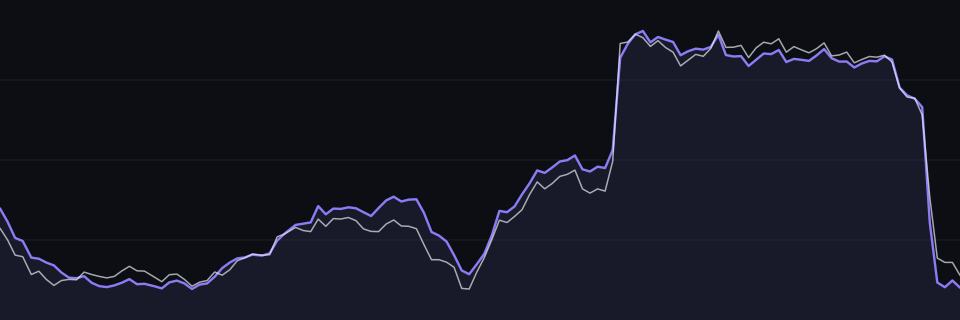
ETH open interest over the same two weeks (336 hours) ranged from $9.1B to $10.4B. The ETH price moved between $2,228 and $2,442.
- Open interest
- $9.2Bfrom $9.6B
- Change
- −3.6%over 336 hours
- Price change
- −1.8%$2,289 → $2,249
- On Hyperliquid
- $2.2B23% of the total
Open interest summed over Binance, Bybit, Hyperliquid, Lighter at the same 5-minute steps; price = Hyperliquid mark.
ETH open interest went from $9.6B to $9.2B, a change of −3.6%. The price went from $2,289 to $2,249, a change of −1.8%.
Side by side
| BTC | ETH | |
|---|---|---|
| Open interest at the start | $16.3B | $9.6B |
| Open interest at the end | $15.6B | $9.2B |
| Change in open interest | −4.3% | −3.6% |
| Lowest in the window | $15.1B | $9.1B |
| Highest in the window | $16.8B | $10.4B |
| Price change | −2.6% | −1.8% |
| Held on Hyperliquid | $3.1B | $2.2B |
| Hyperliquid share | 20% | 23% |
| Venues summed | 4 | 4 |
Start and end alone can hide a lot. The low and high rows show how far open interest travelled inside the window. A small net change with a wide range means positions were built and then removed again, or the other way round, within the two weeks.
Reading open interest against price
Open interest is measured in dollars, so it moves with the price even when no position changes. If the price rises by some percent and nobody trades, the dollar value of every open contract rises by the same percent. The first check is therefore to compare the two changes in each column:
- Open interest changed by much more than the price: positions were added (or removed) on top of the price effect.
- Open interest changed by about the same as the price: most of the change is revaluation of existing positions.
- Open interest and price moved in opposite directions: positions were closed into a rising market, or added into a falling one.
None of these readings says who was right or what comes next. They describe how the amount of positioning changed. Every contract has a long and a short side, so rising open interest alone does not say which side was added. The long/short split of the tracked Hyperliquid positions is on the long/short page.
What else moves open interest
Open interest falls in two ways: traders close positions themselves, or venues close them as liquidations. A sharp drop during a fast price move usually comes with forced closes, while a slow decline over days is more often positions being wound down by choice. Our liquidations page shows the liquidated size per hour for the same days, which separates the two causes. Our post on crypto liquidations in the last 7 days froze a week of those totals at about the same time.
Funding is the third number to read next to these two. Rising open interest with funding above the baseline means the side that pays funding, the longs, was willing to pay to hold its positions. Rising open interest with negative funding means the shorts were paying. The funding page shows the current rates per coin, and Hyperliquid funding rates in early November 2026 froze them across the largest markets.
Where Hyperliquid fits
Hyperliquid held $3.1B of BTC open interest at the end of the window, a share of 20%, and $2.2B of ETH, a share of 23%. That part matters for our other tools, because it is the part with public positions: it is what the BTC heatmap and the ETH heatmap can show, and what the whale pages list. The rest of the open interest sits on exchanges that publish totals but not positions.
Limits of the data
- Summed where allowed. The totals cover the venues named under each block, at the 5-minute steps where all of them reported. A step where one venue was missing is skipped, so the sum never jumps because a feed lagged. Where a sum may not be published, the block falls back to Hyperliquid alone.
- Price from Hyperliquid. The price line and the price change are the Hyperliquid mark, which can differ slightly from other venues.
- The chart is smoothed. The line averages consecutive steps; the high and low values come from the raw steps.
- Frozen. The numbers are fixed at the snapshot time on each block. Sources and update times are listed on the methodology page and on data freshness.
For the current open interest, funding and long/short of each coin, open BTC positioning or ETH positioning.
Sources
Blockmetric data, frozen at the time shown:
- Open interest chart · BTC: Blockmetric Research, snapshot 5 Nov 2026, 17:40 UTC · Live BTC positioning
- Open interest · BTC: Blockmetric Research, snapshot 5 Nov 2026, 17:40 UTC · Live BTC positioning
- Open interest chart · ETH: Blockmetric Research, snapshot 5 Nov 2026, 17:40 UTC · Live ETH positioning
- Open interest · ETH: Blockmetric Research, snapshot 5 Nov 2026, 17:40 UTC · Live ETH positioning
How we collect and check the data: Data & methodology.
See today’s numbersThe figures above are from 5 Nov 2026, 17:40 UTC.
See live BTC positioning