HYPE open interest over 14 days: how much sits on Hyperliquid
HYPE open interest over the 14 days to 5 November 2026, week by week, the share held on Hyperliquid and the five largest tracked HYPE positions.
On this page
Over the 14 days to our snapshot on 5 November 2026 (17:40 UTC), HYPE open interest across the venues we sum changed by −8.4% to $2.4B. Hyperliquid itself held $1.8B of it, a share of 73%. The HYPE price moved −9.1% over the same two weeks. This post splits the window into its two weeks, shows how much of HYPE's derivatives market sits on its home venue and who holds the largest tracked positions.
HYPE is the native token of Hyperliquid. How the venue works is explained in How Hyperliquid works, and how open interest is read in Open interest and long/short. Here we only read two weeks of data.
Two weeks of HYPE open interest
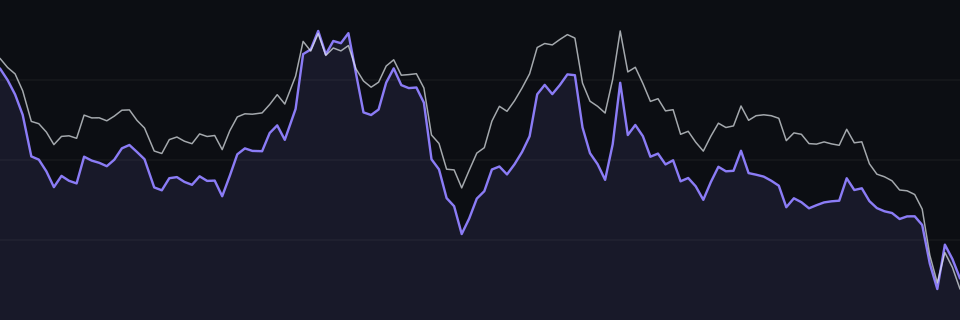
The violet line is HYPE open interest summed over the venues named under the chart; the pale line is the Hyperliquid price of HYPE on its own scale. Over the two weeks (336 hours), open interest ranged from $2.4B to $2.7B. The price moved between $77.8 and $88.4.
- Open interest
- $2.4Bfrom $2.6B
- Change
- −8.4%over 336 hours
- Price change
- −9.1%$85.99 → $78.13
- On Hyperliquid
- $1.8B73% of the total
Open interest summed over Binance, Bybit, Hyperliquid, Lighter at the same 5-minute steps; price = Hyperliquid mark.
At the start of the window HYPE open interest was $2.6B. At the end it was $2.4B, a change of −8.4%. The price went from $85.99 to $78.13, a change of −9.1%.
Week by week
A 14-day change can hide two very different weeks. The second block covers only the last seven days of the same window:
- Open interest
- $2.4Bfrom $2.6B
- Change
- −8.4%over 168 hours
- Price change
- −9.1%$85.99 → $78.13
- On Hyperliquid
- $1.8B73% of the total
Open interest summed over Binance, Bybit, Hyperliquid, Lighter at the same 5-minute steps; price = Hyperliquid mark.
| Open interest | Price | |
|---|---|---|
| Start of the 14 days | $2.6B | $85.99 |
| Start of the last 7 days | $2.6B | $85.99 |
| End of the window | $2.4B | $78.13 |
| Change over the last 7 days | −8.4% | −9.1% |
| Change over all 14 days | −8.4% | −9.1% |
The first week runs from the first row to the second, the second week from the second row to the third. If most of the two-week change shows up in the last-seven-days row, the move happened recently; if that row is small, it happened in the first week.
As with any coin, compare the change of open interest with the change of the price before reading anything into it. Open interest is measured in dollars, so a price move alone changes it. Only the part beyond the price move reflects positions being added or removed.
How much of HYPE trades on Hyperliquid
HYPE is a useful coin to check this for, because it is the venue's own token.
At the end of the window, Hyperliquid held $1.8B of the $2.4B summed across 4 venues, a share of 73%. For comparison, our Bitcoin and Ether open interest post shows the Hyperliquid share of BTC and ETH over the same two weeks.
That share is the part of the market with public positions. The higher it is, the more of the coin's derivatives market our position data covers: the HYPE heatmap and the HYPE whales tab can then show a larger part of the whole picture than they can for most other coins.
What else to read next to it
Open interest only measures size. Three other numbers complete the picture for the same two weeks:
- Liquidations. A drop in open interest during a fast move usually comes with forced closes. The HYPE coin page shows its liquidations hour by hour, which tells forced closes apart from positions closed by choice.
- Funding. When open interest grows while funding sits above the baseline, longs are paying to hold their positions; with negative funding, shorts are paying. Our Hyperliquid funding rates in early November 2026 post froze HYPE's rate next to BTC, ETH and SOL.
- Long/short. Every contract has a long and a short side, so open interest alone does not say which side grew. The long/short page splits the tracked Hyperliquid positions by wallets and by dollars.
The largest tracked HYPE positions
| # | Wallet | Coin | Side | Size | Leverage | To liquidation |
|---|---|---|---|---|---|---|
| 1 | 0x082e…ca88 | HYPE | Long | $108M | 5x | −6.5% |
| 2 | 0xb83d…6e36 | HYPE | Short | $67.2M | 5x | +146.3% |
| 3 | 0x5b5d…c060 | HYPE | Short | $54.4M | 5x | +236.7% |
| 4 | 0x6666…23f5 | HYPE | Long | $35.3M | 10x | −44.2% |
| 5 | 0x45d2…4029 | HYPE | Short | $34M | 10x | +144.6% |
Distance to liquidation = how far the mark price has to move before Hyperliquid liquidates the position (read from Hyperliquid at the snapshot).
The largest tracked HYPE position at the snapshot was a $108M long held by 0x082e…ca88 at 5x, −6.5% from its liquidation price. The second was a $67.2M short at 5x, and the fifth a $34M short.
Comparing these sizes with the Hyperliquid open interest of $1.8B shows how much one wallet weighs in the market. A wallet that adds to, reduces or closes a large position changes that open interest on its own. A wallet is not a person, and a large position can be one leg of a hedged book elsewhere. The whale tracker lists the largest positions live, with size, leverage and liquidation price.
The HYPE liquidation heatmap shows where HYPE positions would be liquidated right now, to compare with the numbers this post froze.
Following HYPE live
- HYPE positioning: open interest, long/short and funding, updated continuously.
- HYPE heatmap: where tracked HYPE positions would be liquidated.
- HYPE whales: the largest HYPE positions and their changes.
- Funding: HYPE funding next to every other coin.
Limits of the data
- Summed where allowed. The totals cover the venues named under each block, at the 5-minute steps where all of them reported. Where a sum may not be published, the block shows Hyperliquid alone.
- Price from Hyperliquid. Price and price change are the Hyperliquid mark.
- Tracked wallets only. The position table shows wallets we follow, not every account.
- Frozen. The numbers are fixed at the snapshot time shown on each block. Sources and update times are on the methodology page.
For the current HYPE open interest and funding, open HYPE positioning.
Sources
Blockmetric data, frozen at the time shown:
- Open interest chart · HYPE: Blockmetric Research, snapshot 5 Nov 2026, 17:40 UTC · Live HYPE positioning
- Open interest · HYPE: Blockmetric Research, snapshot 5 Nov 2026, 17:40 UTC · Live HYPE positioning
- Open interest · HYPE: Blockmetric Research, snapshot 5 Nov 2026, 17:40 UTC · Live HYPE positioning
- Largest positions · HYPE: Blockmetric Research, snapshot 5 Nov 2026, 17:40 UTC · Live whale positions
How we collect and check the data: Data & methodology.
See today’s numbersThe figures above are from 5 Nov 2026, 17:40 UTC.
See live HYPE positioning